Electric vans are capturing an increasingly larger percentage of the Light Commercial Vehicle (LCV) market in Europe. According to the European Automobile Manufacturers’ Association (ACEA)¹, electric models reached 12% of all new van registrations in Q1 2026. However, as new electric van models enter the market, navigating their technical specifications can be a complex task.
At Datatorq, we specialize in processing and standardizing complex automotive data so our clients don’t have to. When analyzing the latest eLCV battery specifications, we encountered a common industry hurdle: varying reporting standards. Depending on the manufacturer, battery sizes are often published using two different metrics. Some list the Gross capacity, while others publish the Net capacity.
To build reliable benchmarking tools, you need standardized data. We took a deep dive into the European electric van market to align these metrics, providing a clear, apples-to-apples comparison of true battery capabilities.
Understanding the Metrics: Gross vs. Net Capacity
For fleet managers calculating exact routing, or automotive analysts building competitive benchmark studies, understanding the distinction between these two figures is critical:
- Gross Capacity: The total physical energy storage built into the battery pack by the manufacturer.
- Net Capacity (Usable): The actual amount of energy the vehicle’s software allows you to use for driving.
The gap between these two numbers is known as the software buffer. According to automotive engineering analyses—such as those highlighted by Electrifying.com²—this built-in buffer gives the battery cells “room to rest.” It reduces internal chemical stress, manages thermal spikes during DC fast charging, and significantly extends the battery’s long-term health and warranty lifespan.
By differentiating the Gross battery capacity from the Net usable capacity, we eliminate the guesswork and ensure our clients have the precise intelligence they need to compare vehicles fairly.
Here is how the European eLCV batteries compare when Gross vs Net data is fully normalized.
The Small Van Segment
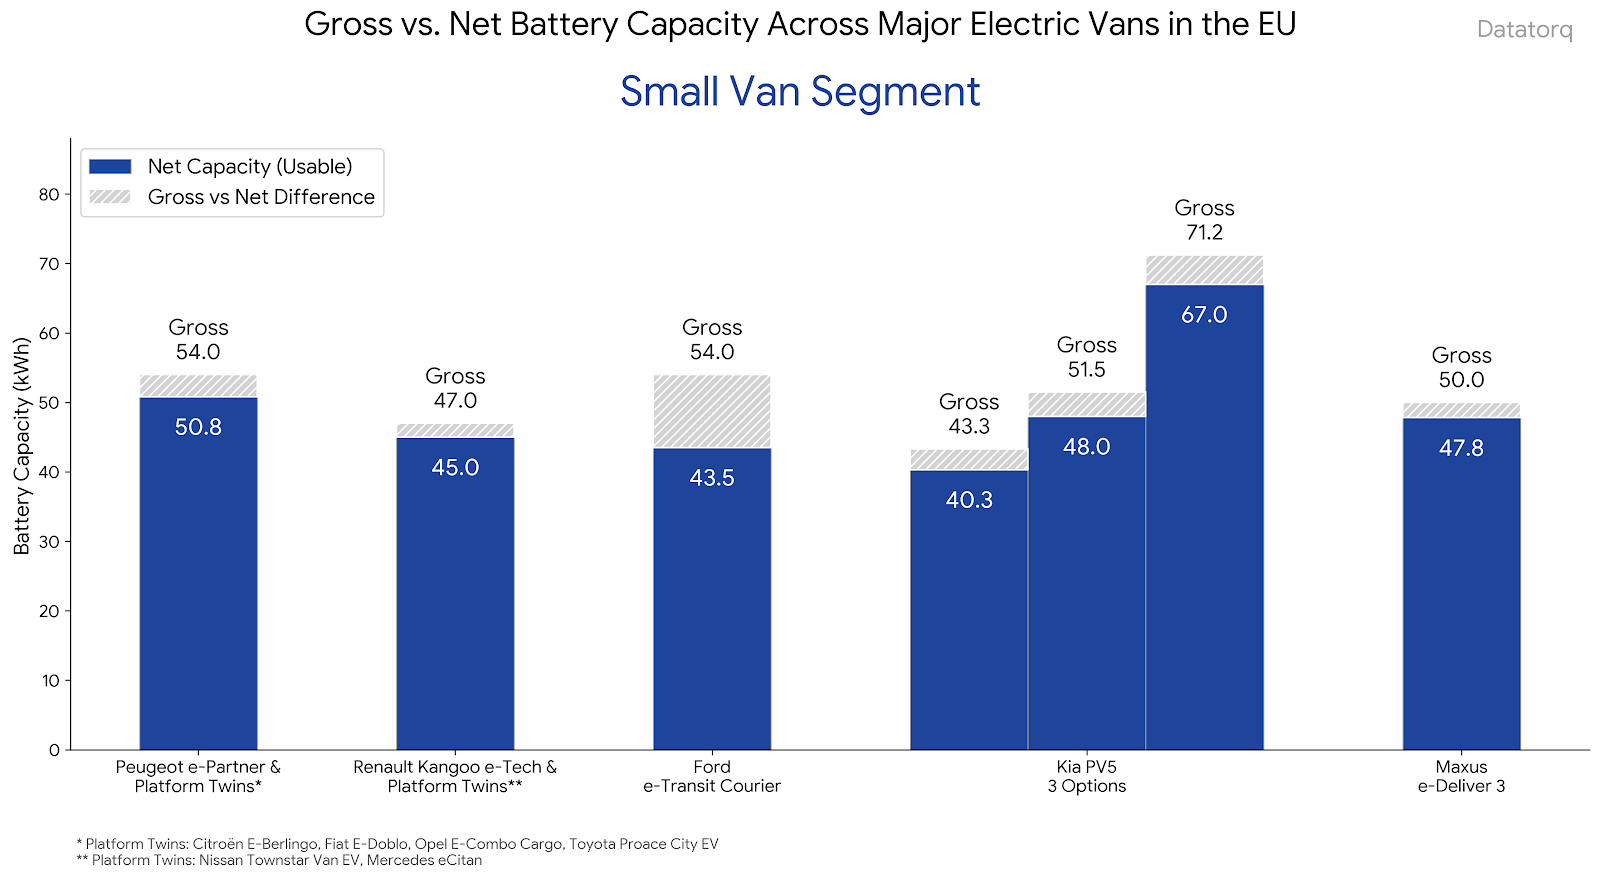
The compact electric van segment is heavily defined by efficient platform sharing. Automotive groups like Stellantis and the Renault/Nissan alliance utilize highly standardized battery packs across multiple brand badges. You’ll notice that the protective software buffer in this segment is generally quite tight—usually around 2 to 4 kWh, except Ford’s e-Transit Courier for which the buffer is over 10kWh. Meanwhile, new entries like the Kia PV5 are introducing greater modularity, offering three distinct battery sizes to give buyers highly granular choices without needing to size up their vehicle.
The Medium Van Segment
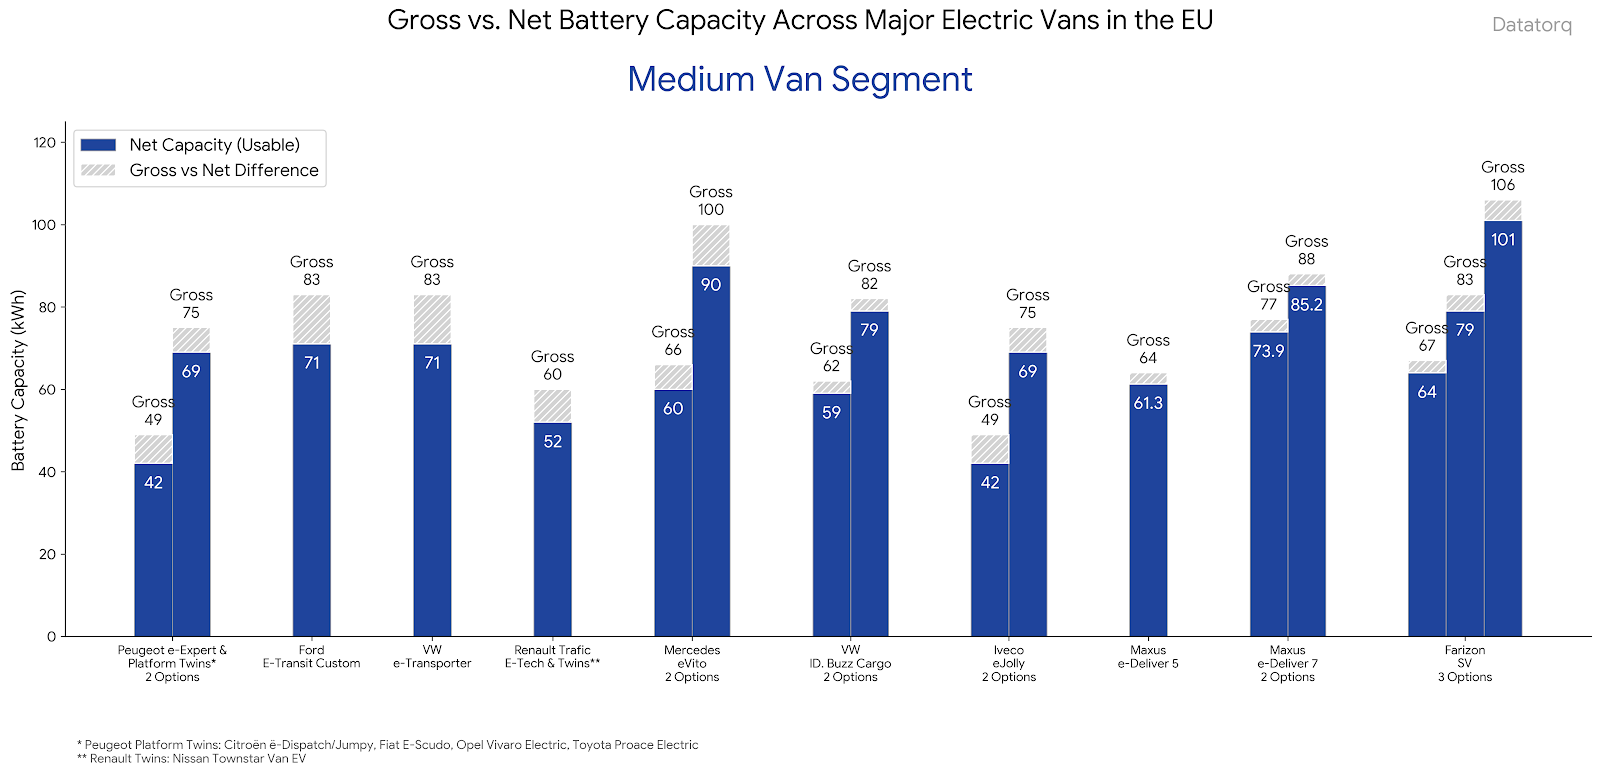
The medium segment represents the workhorses of the European fleet. The data here reflects a massive variety of operational use cases. We tracked everything from 42 kWh Net packs optimized for localized, high-efficiency last-mile delivery, scaling all the way up to massive 101 kWh Net (Farizon) and 90 kWh (Mercedes eVito) packs built for heavier regional transit. For companies relying on accurate automotive benchmarking, this chart highlights that automakers are rapidly diversifying their mid-size offerings to capture highly specific fleet profiles.
The Heavy Van Segment
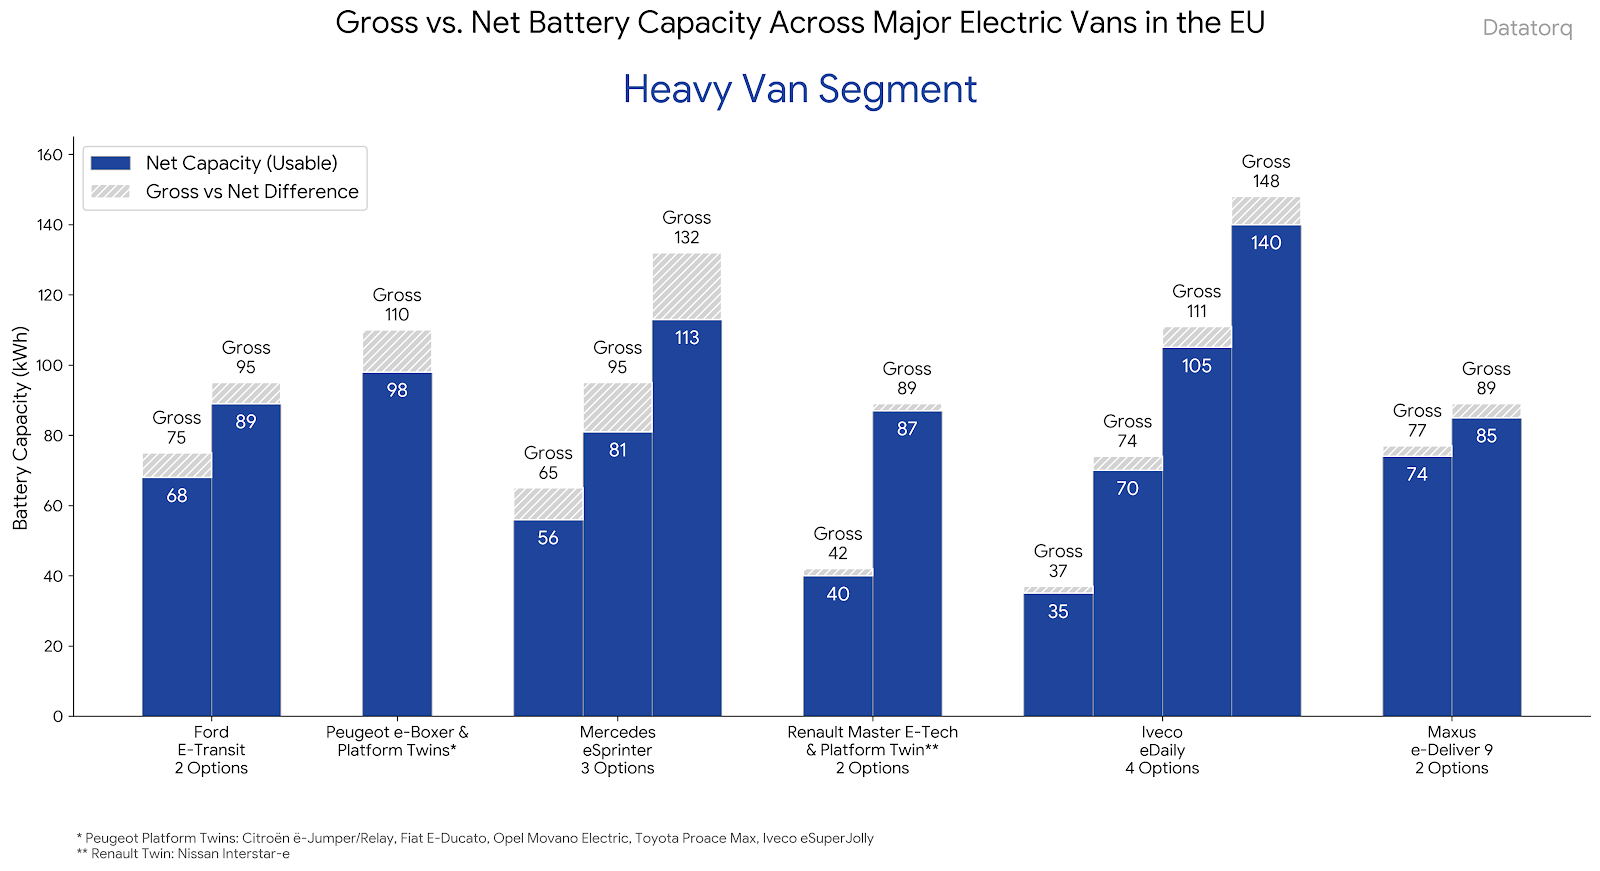
When payloads increase, battery reserves must scale aggressively. This segment shows the widest spread of battery technologies on the market. Iveco stands out with its highly modular eDaily platform, offering up to a staggering 140 kWh of usable capacity across four distinct configurations. Our data normalization clearly shows that in the heavy segment, scalable battery flexibility is just as critical a spec as raw cargo volume.
Reliable Automotive Data Drives Better Decisions
Whether you are a fleet operator making a capital investment, a leasing company calculating residual values, or an enterprise building automotive intelligence tools, you shouldn’t have to spend hundreds of hours standardizing spec sheets.
Over the coming weeks, we will be publishing a dedicated series of posts breaking down the electric vans currently available on the market, covering everything from payload efficiencies to total cost of ownership.
Need to power your insights with transparent and reliable automotive data? Datatorq does the heavy lifting so you can focus on strategy. Contact our team today to access top-notch car prices, standardised global specifications, and reliable benchmarking data across more than 25 markets.
References:
[1] European Automobile Manufacturers’ Association (ACEA). “New commercial vehicle registrations: vans +2.3%, trucks -10.7%, buses +24.5% in Q1 2026.” Available at: https://www.acea.auto/cv-registrations/new-commercial-vehicle-registrations-vans-2-3-trucks-10-7-buses-24-5-in-q1-2026/
[2] Electrifying.com. “What is usable battery capacity in electric cars?” (Explaining gross vs. net capacity and the role of the software buffer in preventing cell degradation). Available at: https://www.electrifying.com/blog/article/what-is-usable-battery-capacity-in-an-ev